Real Rate of Return

Numbers don’t lie but it sure can be deceiving – The Bronze Alchemist

No, it’s not a “thing” of mine to start the post with a quote. But if I can summarize this post in one sentence, it would be what I mentioned above. Let’s say you have an investment portfolio worth $100,000 and it gave you a return of $10,000 in the year, then you have earned 10% (actual return / portfolio value). Your asset “manager” (fund house, bank, debtors etc.) will acknowledge over an official looking transcript that you have earned 10% on your overall portfolio. There is no doubt on the amount you have earned; the return number on this transcript is as true as the sun in the sky. You are basking in the full shine (returns) of the sun (your portfolio) and it’s making you warm.

However, as it always happens, there are some dark clouds in the sky, preventing you from benefiting from the full warmth of your returns. This dark cloud, Inflation, is one of the most significant risk affecting your future returns.

There are many factors to consider, but for this post and for all practical purposes,

Real rate of return ≅ Nominal rate of return  – Inflation rate

i.e., to calculate your real returns from assets, you have to subtract the returns from the official looking transcript for inflation adjustments. ( In case of deflation, you add the rate to your returns ).

In the previous post, I showed you how inflation can throw a wrench in your retirement plans. This post on real returns could be considered an addendum to the previous post; and to serve a reminder: consider all factors a.k.a “risks” on the returns. Simply put, in 2015

  • If there were a 2% inflation in your country, your real return is 8% (10% – 2%) or only $8000 and not $10,000
  • For 5% inflation, real return is is 5% (10% – 5%) or only $5000 and not $10,000
  • For 10% inflation, real return is 0% (10% – 10%) or $0 and not $10,000
  • For 11% inflation, real return is -1% (10% – 11%) or -$1000 and not +$10,000

I know you are good at mathematics and can do basic calculations; but I cannot emphasize the above point enough. You lose money to inflation, for no fault of your own as an individual, just for having the privilege to be part of your country’s economy. Keep in mind that when I say -$1000, no one is going into your bank and take $11,000; your economy does it. So that’s why the numbers can be deceiving. You have $10,000 worth of money in your bank but you have to pay extra $1000 to be able to buy a group of items for which you paid $10,000 a year before. If this statement seems confusing, take a look at my previous post on inflation or search for it on the web.

Ideally, your choice of asset class should be able to provide you inflation beating returns. In terms of Safe Withdrawal Rate or SWR, if you have a specific percentage, say 3%, you have to make sure that the nominal return is at least 3% (or 300 basis points) above inflation rate. If inflation is 5%, you need 8% returns. But if inflation is 0%, you only need 3% returns. If there is a -1% inflation (or 1% deflation), you only need 2% returns. You get the picture.

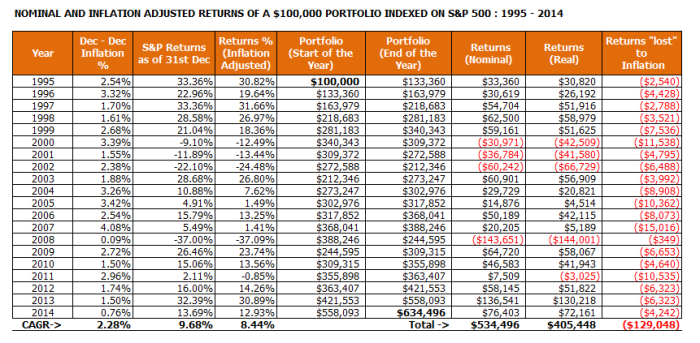
Enough of this monkey business! Nothing hits harder than the truth so let’s look at some actual numbers. I did a simple projection of calculating USA’s S&P 500 index performance from 1995 to 2014 (20 years) with and without inflation adjustment. I assumed my initial portfolio value to be $100,000 that I will invest in a strict S&P 500 indexed fund on Jan 1, 1995. I am not adding any subsequent amounts to the portfolio, just letting the market do the work for me. Look at the results below:

NOMINAL AND INFLATION ADJUSTED RETURNS OF A $100,000 PORTFOLIO INDEXED ON S&P 500 : 1995 - 2014

Source:
Inflation: http://www.inflation.eu/inflation-rates/united-states/historic-inflation/cpi-inflation-united-states.aspx
S&P historical performance: https://ycharts.com/indicators/sandp_500_total_return_annual

My $100,000 portfolio has grown to $634,496 by the end of 2014. However due to inflation, the actual value of my portfolio in today’s dollars is worth only $505,448, losing almost 1/4th of the portfolio value (a factor of 1.2905 to be exact). And you know what the bad thing is? I cannot do anything about it. In fact, I should consider myself lucky to have invested in S&P 500. If I had invested in Certificates of Deposits (CDs), T-Bills or other bonds, I would have been barely able to improve my portfolio, definitely not to the tune on the amount returned by S&P 500. What if I were paranoid about the stock market and just hoarded all $100,000 under my mattress? Well, that would have yielded only $55,000 worth purchasing power in today’s dollars.

With regard to the point I am trying to make – use real return rate in SWR calculation – all is fine and dandy, except for one small issue: inflation lags behind by the unit of time that takes for your government to publish inflation rates. In USA, you can get monthly rates, so it is easy to adjust if you want to do it monthly. Yearly adjustment would do just for USA, the inflation rates are relatively steady in this part of the world.

My point, keep it real.

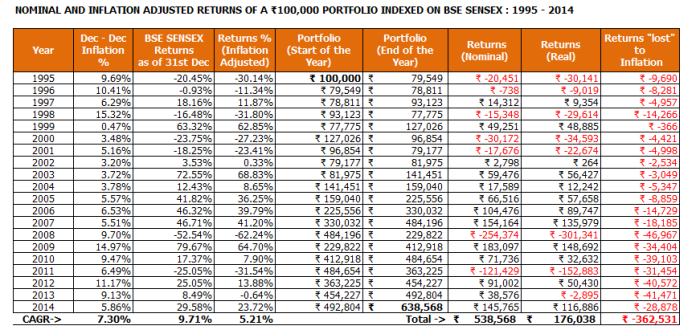
As a bonus, I am presenting below the projections from India to understand how things are with good developing economies. India is part of the BRICS bloc (Brazil, Russia, India, China and South Africa). Indian economy developed rapidly in the past two decades thanks to IT boom and then later to manufacturing boom. I used BSE SENSEX as the benchmark index and started with ₹100,000 portfolio. As per the data, I lost over 67% of the returns to inflation or by a factor of 3.6253 for every rupee. Wow! Although, the ETFs in India don’t do as well as actively managed funds over there. It’s possible to have better returns using good and stable active mutual funds, good blue chip stocks or if money were invested in real estate; the valuations growth were phenomenal in the past 20 years.

NOMINAL AND INFLATION ADJUSTED RETURNS OF A ₹100,000 PORTFOLIO INDEXED ON BSE SENSEX : 1995 - 2014

How about this for an observation?

Even though the average#1 returns from India was 9.71% over the 20 years, because of the average#1 inflation of 7.3%, the average real rate of return was only 5.21%. Compare that to USA’s, whose average#1 returns were only 9.68% However due to average#1 inflation being only 2.28% over 20 years, the average return came out to 8.44%; better than India’s. Warning: Things are never as simple as this in real, there are many complex factors to consider, and whatever adjustments we make, we always end up comparing apples to oranges.

Source:
Inflation: http://www.inflation.eu/inflation-rates/india/historic-inflation/cpi-inflation-india.aspx
BSE SENSEX historical performance: http://www.bseindia.com/indices/IndexArchiveData.aspx

#1Compounded Annual Growth Rate or (CAGR) is calculated by the formula

CAGR = [(Final value/Initial value) ^ (1/number of time periods)] – 1

For example, with initial value ($100,000) and final value ($634,496), this would be 9.68%. In excel you would use this formula “=RATE(20,0,-100000,634496)”
Inflation

“Inflation eats your money faster than termites.” – The Bronze Alchemist

One of the underlying principles of Financial Independence is letting your money work for you. Forget about assets, portfolio, investments and all other jargon for a minute; they are just candy wrappers over the “real deal”, money. Letting YOUR money work for YOU is akin to letting it exercise; money initially works out slowly but as time progress it exercises faster and better, and is able to “bulk up” and be alert and nimble to “unforeseen financial accidents.” Unlike us, however, there is no limit to how much money can bulk up. But if you let money just sit idly, it loses it’s “power” and agility and slowly withers away, eventually becoming a shadow to what it was once. So it makes sense to let the money “work out.”

My analogy might be over the top, but I believe you got it’s essence. It’s an absolute waste of your potential to let the money you earned to just sit idly rather than have it invested, so that your money doesn’t lose its purchasing power due to inflation. Let’s start with a simple example based on USA’s CPI numbers. There is a nifty online inflation calculator that I’ll use for my illustration.

  • In USA, if it had cost you $100 to purchase a basket of items in 1990, you will need $181 to purchase the same basket of items in 2015.
  • This amounts to an average increase of 2.40% per year for 25 years.

Okay, it is not that bad. Only $81 increase over a period of 25 years with a measly 2.40% average yearly increase. Now let’s plug in this data into our hypothetical cash flow requirement of $55,000#1 per year.

In USA, if I needed $55,000 to pay for my expenses in 1990, I would need $99,563 in 2015 to keep up with the same standard of living.

Let the above statement sink in for a second. I didn’t modify any parameters, just changed the initial $100 to a more realistic value that might mirror my expenses. And the extra $81 has now morphed into a humongous $44,563. As I always say, past might not be a predictor of future, but even if the average yearly inflation in USA is assumed to be just 1% over the next 30 years, $55,000 required today will have to be $70,533 in year 25, and $74,131 in year 30.

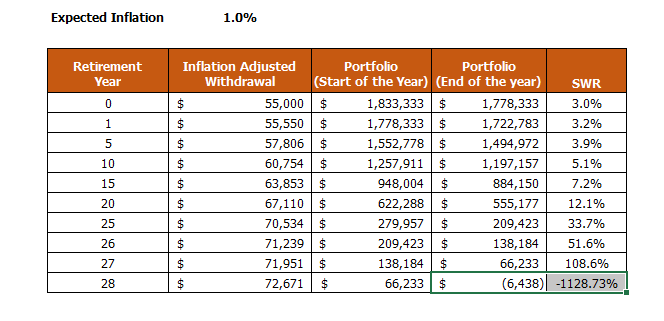
Let’s consider our usual hypothetical portfolio. Assume that I have “all cash” portfolio of $1.83 million, using a Safe Withdrawal Rate (SWR) of 3% to give $55,000 during first year of retirement. I’ll also assume an average yearly inflation of just 1% and that I would like to adjust my withdrawal to the inflation, so that I can enjoy the same standard of living. Take a look at the below projections.

"Inflation

Just look at how SWR crumbles over the years! You’ll see that at the end of year 28 (or beginning of year 29), I am, hmm, how to put delicately, caught with my pants down. This is the same scenario that gave me a 100% success rate over 50 years using firecalc. Now if I adjust the inflation to 2.40% (previous 25 year average), my cash portfolio runs out at year 23. And we all know that life is never one smooth ride (if it is, what’s the fun in it anyway!). And there will be unexpected expenses such as health, travel and repairs/maintenance along the way. If I won’t let the money grow, all these amounts are gone from my portfolio, FOREVER.

For sure, having $1.83 million in your retirement folio is no mean feat; in fact, less than 10% of USA nationals manage to amass anything more than $210,000 in retirement accounts as per a survey conducted by US Federal Reserve in 2013. Rest assured, those with a million dollar nest egg would be a rare breed indeed. What about the country you live in, if you are not from USA? Just check the government data if available, and I can assure you that the nest egg that you have in mind will be definitely within the top 5% in your country. Why else would you be reading this blog anyway!

How do I remedy this situation? Simple, I need to make sure I let my money earn at least 1% on the portfolio on average per year so that I can keep the SWR unchanged. That’s it. You need to let your money work so that you control your SWR instead of inflation controlling it. And you let your money beat the inflation by investing in assets that you understand and can control.

#1 For simplicity purposes, I have assumed that I don’t receive any pension, annuity or social security benefits. If you do receive them, great! But the social safety net provided in USA and a few other developed countries might not be available in many countries in the world.

SWR Rigidity

In the previous post, we discussed Safe Withdrawal Rate (SWR) of our portfolio and how to pick parameters to make sure that we have enough money to keep up with our needs throughout our retirement. The concept of SWR can be extended to any type of portfolio, but the flexibility of the portfolio in terms of varying SWR differs based on our portfolio composition.

Let’s say my portfolio consists only of real estate, considered an illiquid asset. I have two rental homes with total asset value of $550,000 generating $4600 as rent cheques per month, a situation that’s reasonably less fluctuating than stock market. Mind you, there is no such thing as guaranteed returns, as many things can go wrong while holding valuable real estate that affect the periodical rent cheques. Less than 100% occupancy rates, delinquent tenants, major repairs and damages are some of the reasons affecting your cash flow. Many of the costs might have to borne by the landlord completely if insurance doesn’t exist or doesn’t cover. But as I said above, real estate offers a relatively stable income stream compared to non-real estate investment instruments.

Now the downside of this portfolio is, you guessed it, it is stable. You can raise rents, but not be able to raise 10% – 20% to match the market returns or index it to the inflation. If you are in parts of the world with rent regulation/rent control, there is a ceiling as to how much you can raise the rent. More importantly, you cannot withdraw more for sudden expenses, unless you sell your real estate, take the money you require and buy another real estate with left over money#1. In most of the cases, the resulting rent cheque will be lower than the previous one. And when you do this, your cash flow for the subsequent periods will be diminished and you have to reduce your retirement lifestyle FOREVER. Note that there could be scenarios where the real estate might have appreciated in value and/or you might be able to generate the same rental value but for general cases let’s assume: lower cost of rental = lower value in rental cheque.

So a couple of “bad’ years in expenses during your retirement years ( medical expenses, unexpected travel etc.) can seriously diminish your average yearly cash flow.#2 My point here is not to show real estate portfolio in a bad light; in fact, real estate it is one the best asset class to hold. I merely want to state that how rigid your SWR becomes in a pure illiquid portfolio. In fact, a decent dose of real estate in your portfolio would add the much needed stability to your yearly cash flow, kind of giving you “minimum guaranteed returns” on top of which you can design your yearly expenses.

Based on the above observation, we can define SWR rigidity as “the degree to which SWR can be modified year-on-year as per withdrawal needs.

SWR Rigidity = Amount of illiquid assets/Amount of total assets

SWR rigidity is directly proportional to the ratio of illiquid assets in your portfolio and inversely proportional to the volatility of your yearly cash flow. So, more illquid the portfolio, more rigid the SWR and less volatile the yearly cash flow.

#1 I am not even factoring broker fees, other sundry transaction costs and applicable taxes.
#2 You can still do plenty of things here, sell the assets and use the cash directly or getting a reverse mortgage.